
Diagrams, Charts, and Equations: Make Complex Ideas Visible
Turn systems, decisions, data, formulas, and scientific concepts into clear native visual artifacts that teams can inspect together.
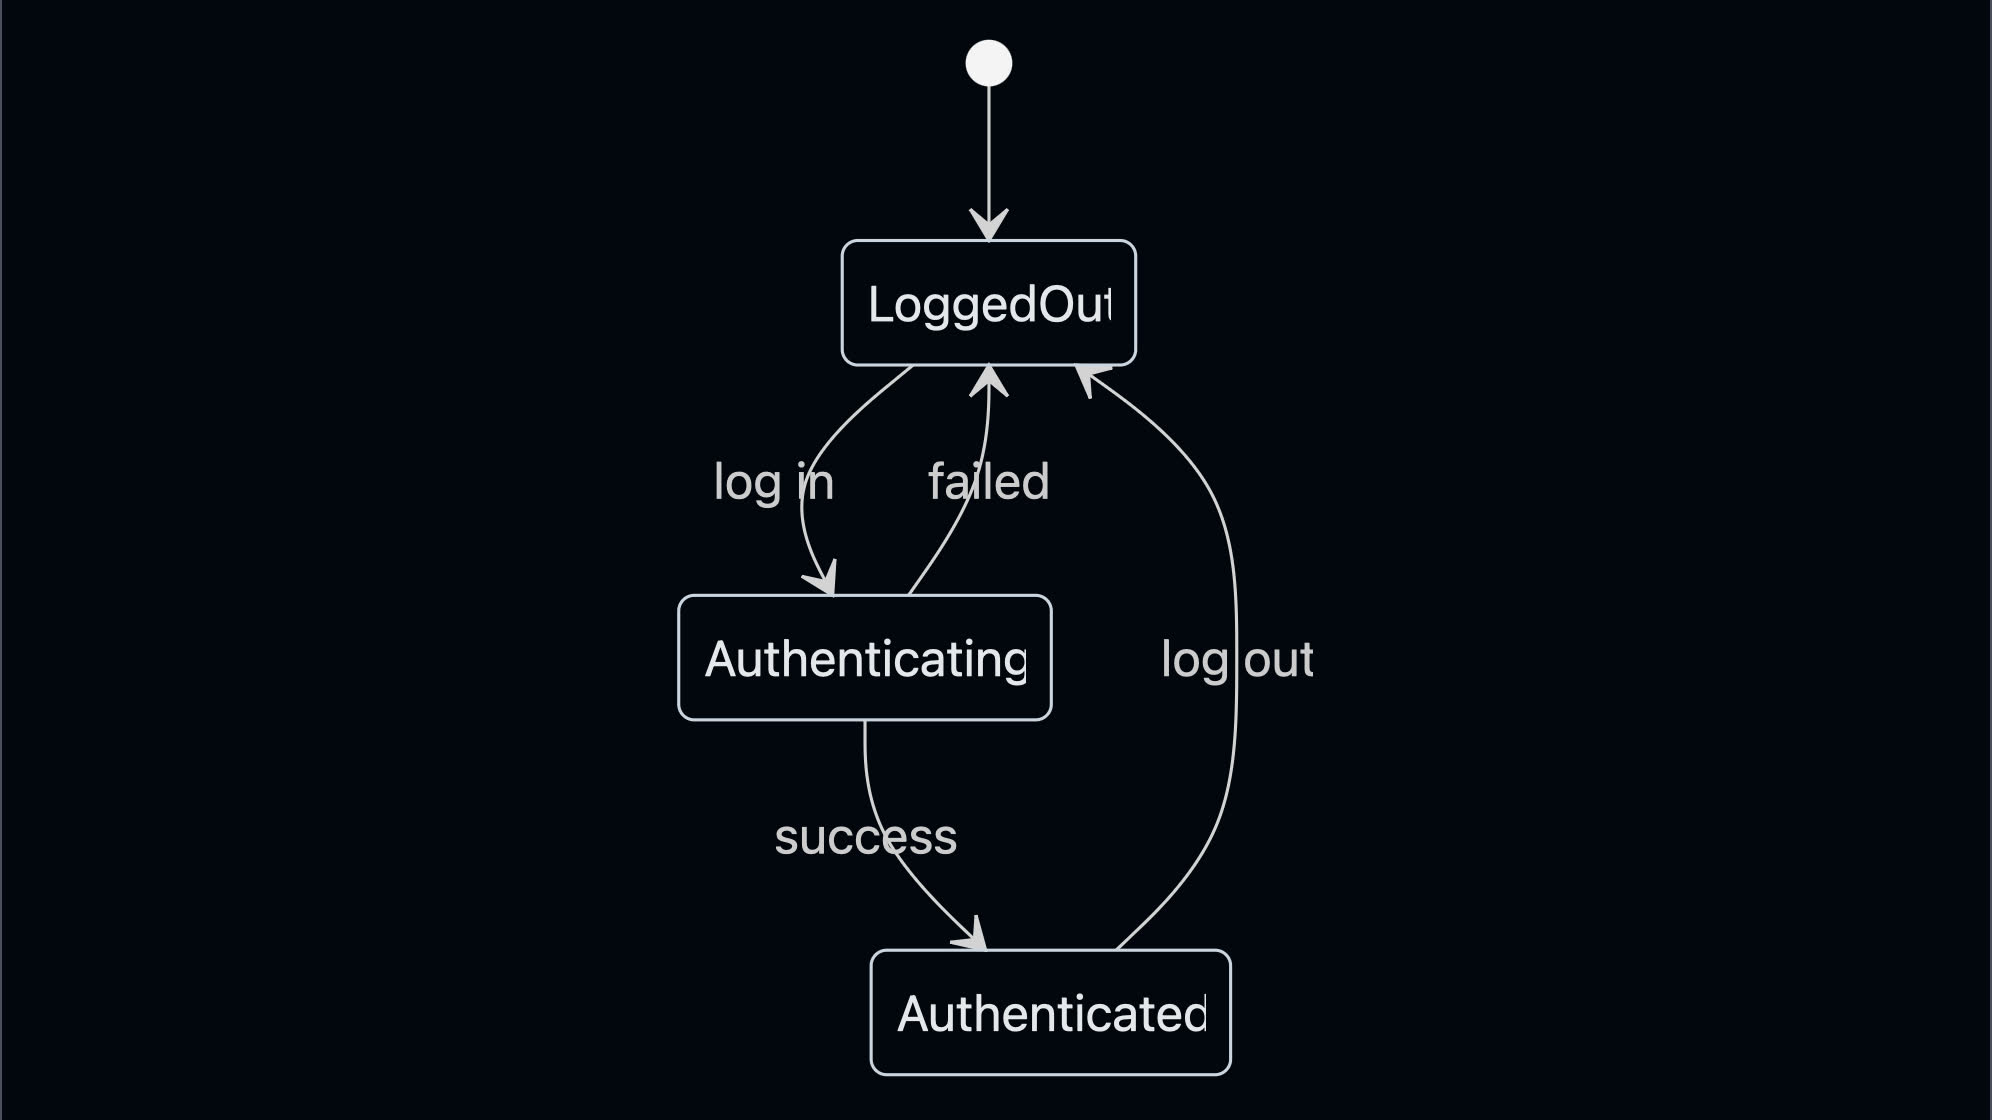
Some ideas become clear only when they are visible. A state machine shows permitted transitions. A flowchart reveals a decision path. A chart makes comparison easier. An equation describes a relationship precisely.
Dojo treats these as native visual artifacts—not decoration pasted below another wall of prose. The goal is something a team can inspect, discuss, revise, and use to make a decision.
Start with the communication problem
Ask what a viewer should understand after ten seconds. Which entities, relationships, sequence, labels, units, or decisions carry the meaning? Establish that structure before styling.
A useful diagram is selective. It makes the primary route easy to trace and separates exceptions when one canvas becomes overloaded. A useful chart chooses its form from the question: lines for change over time, bars for category comparison, scatter plots for relationships, and distributions for variation.
Clarity is stronger than density.
Match the artifact to the idea
Use a state machine when behavior depends on current condition: pending, active, paused, completed, failed. Use a flowchart for procedural paths and decisions. Use a sequence diagram when the important truth is who calls whom and in what order. Use an architecture map for components and dependencies.
Equations preserve symbolic precision. Pair them with explanation when readers need to understand each term or the physical and business relationship behind it. Scientific visuals should distinguish observation, mechanism, model, and uncertainty.
Revise for truth and readability
Check whether a first-time viewer can identify the starting point, main relationship, and intended conclusion. Remove ambiguous arrows, overloaded labels, inconsistent terms, decorative clutter, and color choices that fail in grayscale.
Charts need correct axes, units, ranges, sources, and uncertainty. Equations need defined variables and assumptions. Scientific illustrations should make clear whether they are schematic, measured, conceptual, or hypothetical.
Visual polish earns attention. Factual structure earns trust.
Give the idea the shape it deserves
Visual artifacts turn vague conversation into a shared model. They expose hidden dependencies, make decisions traceable, and let people point to the exact part they understand differently.
Dojo helps teams create diagrams, charts, and equations inside the working conversation so complex ideas can be seen, reviewed, and improved—not merely described.